
Why a Root Cause Analysis (RCA) Mindset Can Bring Down a System During a Production Incident

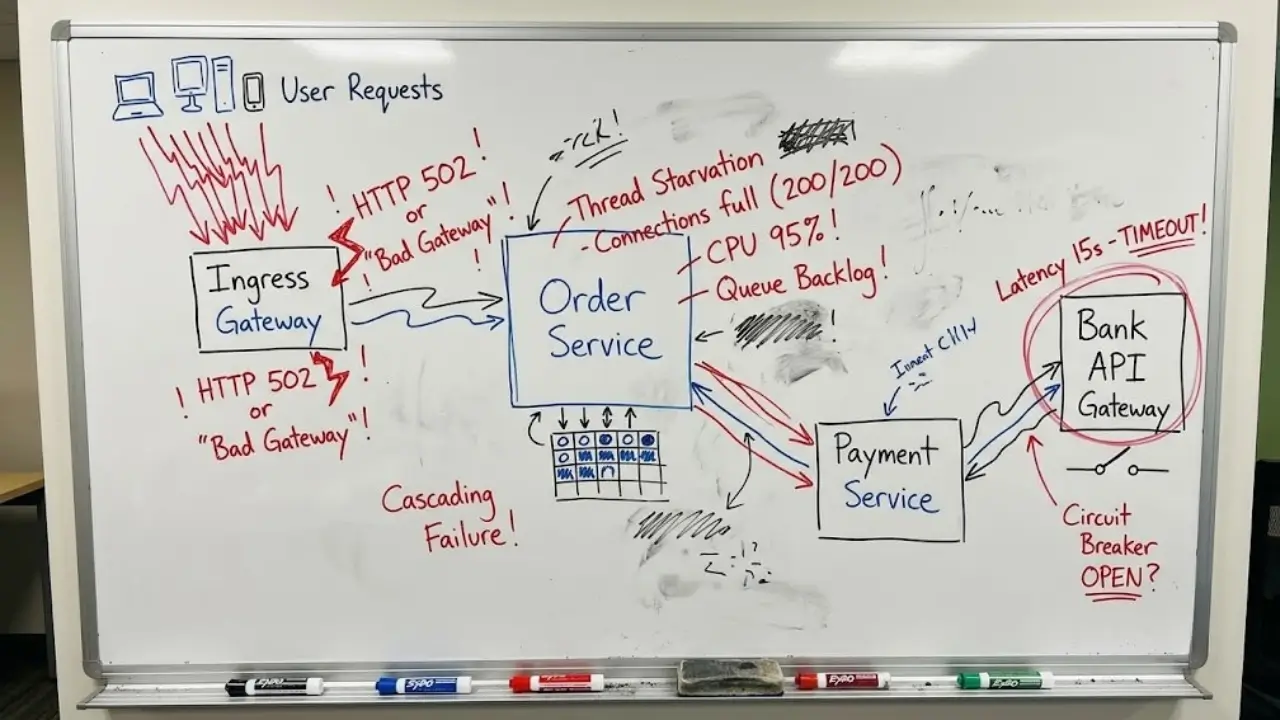
Our team recently ran into a Production incident in our Ecommerce system. I thought the experience might be useful to others, so I wanted to share what actually happened. This is based on my personal experience and the technologies we use where I work, so take it for what it is and focus on the underlying mindset. I’ll definitely summarize the lessons learned toward the end.
I’ve also seen how DevOps VietNam contributes to the growth of the community, bringing real benefits to engineers while helping companies spread their value. That made me want to contribute something as well, so hopefully this practical experience can stay around and help others over the long term.
The problem started when HTTP 502 errors suddenly spiked across the system. A Software Engineer facing this situation might open a terminal, fire up an APM tool, inspect traces one by one, and dig through logs to find the exact piece of code that just threw an exception. From talking with the SEs on my team, this is also a fairly common instinct.
In a development environment such as dev or staging, this reaction shows sharpness and professionalism. It makes sense: an engineer does not want a patched together workaround. They want to dig all the way down to the root cause to protect the integrity of the codebase.
But if you apply that same instinct unchanged during a serious Production incident, especially a Severity 1 incident, it can become a dangerous way to respond.
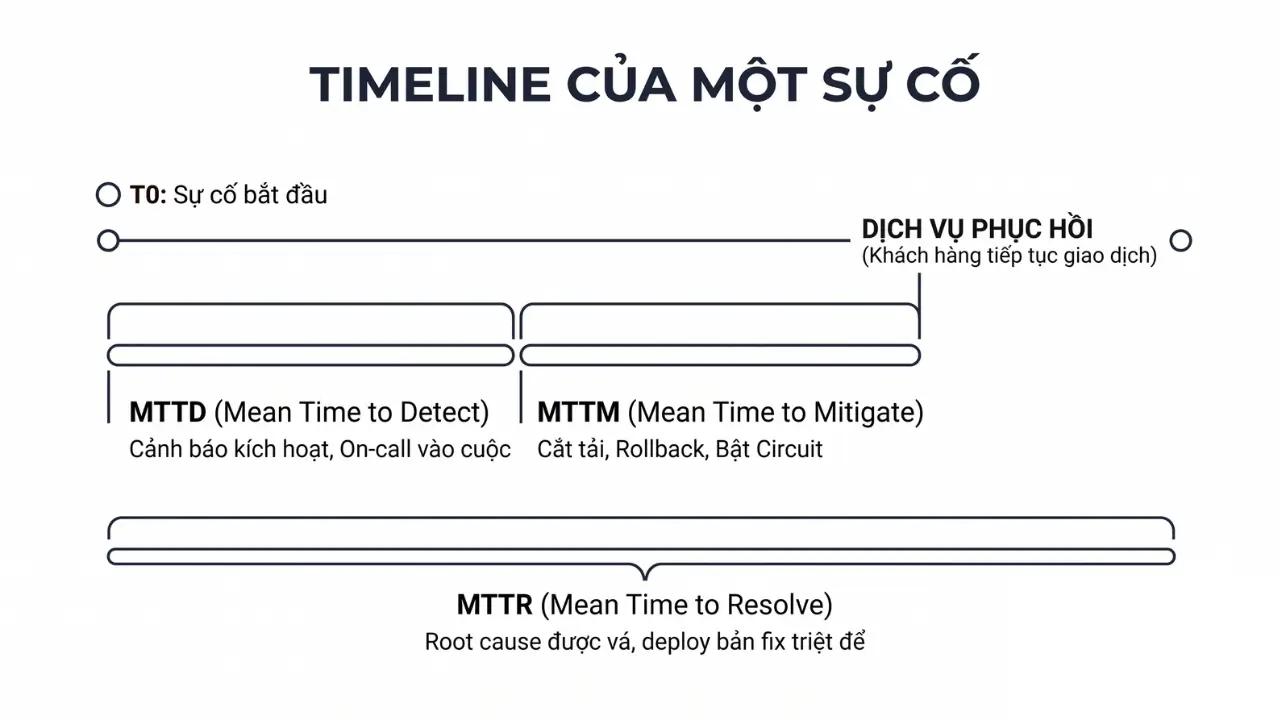
In my view, when it comes to operations, the metric that matters most to the business is not how quickly you find the bug. It is MTTM (Mean Time to Mitigate), the minimum time needed to bring the system back into a state where it can serve users again.
A complete fix, or MTTR (Mean Time to Resolve), can absolutely come afterward, once the “fire” has been put out.
Case Study: Cascading Failure at the Payment Gateway
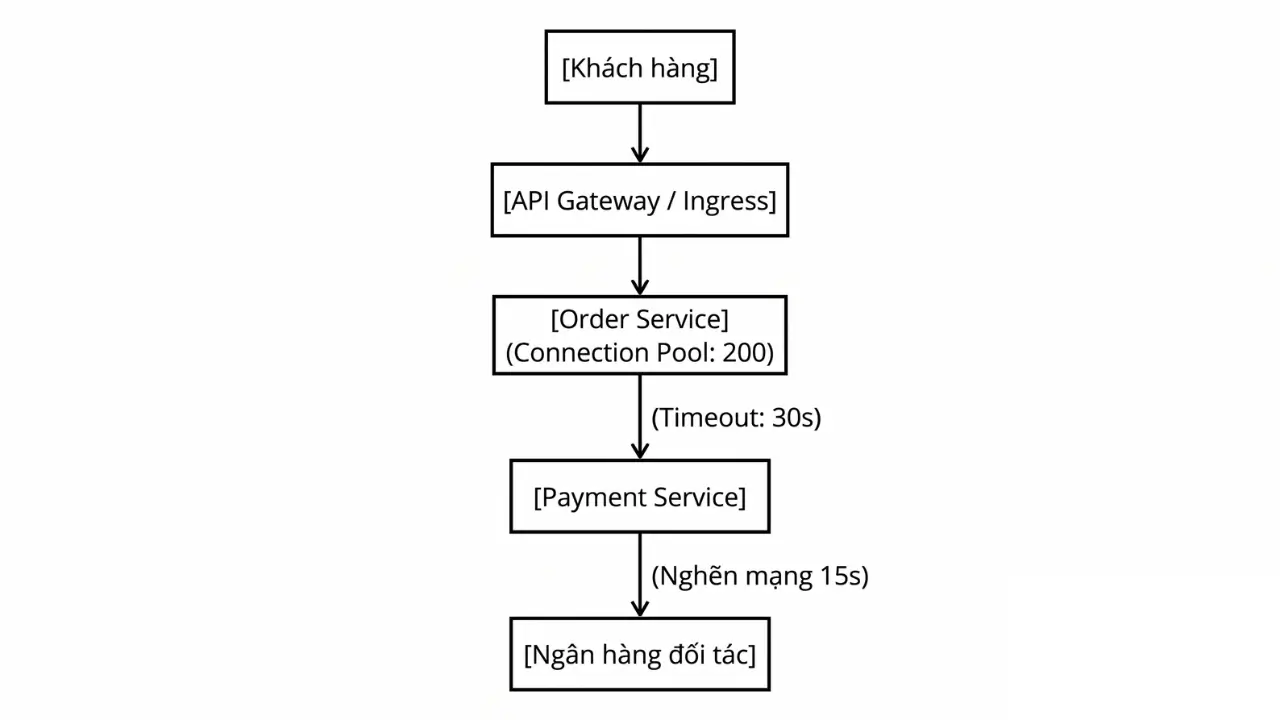
Here is a simplified version of the distributed architecture we actually run for an Ecommerce platform: the order intake service, Order Service, communicates over HTTP/gRPC with an internal payment gateway, Payment Service, which then authorizes transactions through the API of an external partner bank.
What Actually Happened
I’ll describe the incident in concrete terms, although the numbers are intentionally approximate because the exact figures are a little sensitive:
- The partner bank experienced a network routing issue, pushing average response latency from 120ms all the way up to 15,000ms or 15 seconds.
Order Servicewas configured with an HTTP connection pool capped at 200 connections, with the defaultread_timeoutset to 30 seconds.- Under peak traffic of 80 orders per second, in less than 3 seconds, all 200 connections in the pool were waiting on I/O from the bank.
- Worker threads became tied up, the cache filled up, and
Order Servicefell into Thread Starvation. It was no longer just the payment flow that was blocked. Even lightweight operations such as viewing order details or looking up purchase history started getting rejected. - The Ingress Controller kept sending health check probes to
Order Service, but they timed out more than 3 times in a row. The Ingress automatically marked the containers as Unhealthy and started returning HTTP 502/504 errors across the application.
Comparing Two Ways of Responding in the War Room
This section is about incident response mindset. I’m definitely not saying one role is right and the other is wrong, and I’m not judging either position. Everyone has a different responsibility. I’m only pointing out the contrast so anyone interested can better understand how the other role may see the situation.
| Criteria | Engineer with a Debugger Mindset | Engineer with an Incident Commander Mindset |
|---|---|---|
| Immediate action | Opens Datadog APM, SSHes into the server, inspects exception logs line by line, and checks SQL statements for possible table locks. | Reads the dashboard and identifies the blast radius: the payment cluster is dragging down the entire Order Service. |
| Assessment & response | Suspects an excessively high timeout or a memory leak, opens the source code, changes a parameter in .env, creates a Pull Request, and waits for CI/CD to build a new Docker image. |
Identifies third party I/O congestion as the cause. Immediately executes the predefined incident response plan: isolate the failing dependency and protect the core business flow. |
| Intervention | Avoids deeper intervention out of concern that the “code may no longer behave according to the original logic.” Waits 20 to 30 minutes for the patch to deploy. | 1. Manually activates the circuit breaker for the failing bank gateway. 2. Enables a Feature Flag to redirect payments to the internal e-wallet or COD. 3. Enables Rate Limiting at the Gateway to reduce pressure on the web cluster. |
| Actual outcome | The system experiences a widespread outage for 35 minutes. Customers respond negatively and the business suffers direct revenue loss. | Core service recovers in 3 minutes. Only the affected bank payment method is intentionally suspended. |
Architectural Patterns for Survival Mode
A mitigation mindset cannot do much if the system is built as a monolith with no “safety switches” available.
In my view, if you want to mitigate an incident within tens of seconds, the infrastructure needs to have patterns like these built in from the start.
Proactive Circuit Breaker
Do not let internal resources get consumed by a slow upstream or downstream dependency.
A proper circuit breaker module should automatically open the circuit when the failure rate exceeds an acceptable threshold, then immediately return a fallback response:
// Configure Circuit Breaker with Sonyflake/Gobreaker
// Obviously I can't show the actual production code, so this is only a sample
var cbSettings = gobreaker.Settings{
    Name:        "BankPaymentGateway",
    MaxRequests: 5,                   // Number of trial requests while in Half-Open state
    Interval:    10 * time.Second,    // Interval for resetting the failure counter
    Timeout:     30 * time.Second,    // How long the circuit stays Open before moving to Half-Open
    ReadyToTrip: func(counts gobreaker.Counts) bool {
        failureRatio := float64(counts.TotalFailures) / float64(counts.Requests)
        return counts.Requests >= 20 && failureRatio >= 0.5 // Open the circuit if failures >= 50% across at least 20 requests
    },
}
When the circuit is in the open state, the system stops sending additional requests outside and immediately releases worker threads that would otherwise remain stuck.
Load Shedding & Request Prioritization
When server CPU exceeds 85%, instead of stubbornly trying to process every request until the entire system goes down from Out-Of-Memory (OOM), the system should proactively reject lower priority traffic at the API Gateway layer:
- Low priority group (Drop immediately): telemetry collection, personalized product recommendations, article view count updates.
- High priority group (Protect as much as possible): account authentication, charging a shopping cart, recording order status.
Graceful Degradation
A resilient architecture, in my view, should be able to operate in several different states instead of having only two:
Running perfectly or completely dead.
When the primary database cluster becomes overloaded with write I/O, the system can switch to read-only cache mode. Users are still allowed to browse products using cached data from Redis/CDN, while the application displays a notice that new orders are temporarily paused for a few minutes to let the database cool down.
Availability vs. Data Integrity
Although the top priority of Incident Response is restoring service, there is one absolute boundary that must never be crossed:
Data integrity.
Between temporary system downtime and a system that continues running while corrupting financial or user data, incorrect data is far more catastrophic.
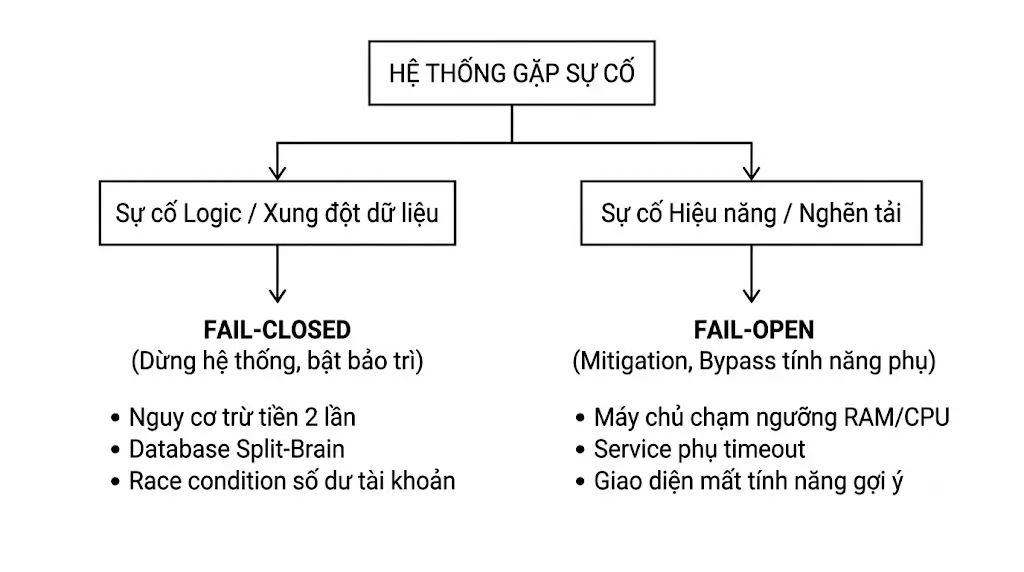
- Fail-Open principle: Use this when the failure only affects user experience. If the product recommendation system goes down, bypass it and return a static list of best selling products. If the user avatar validation system fails, assign a default image.
- Fail-Closed principle: Use this for asset accounting flows, identity verification, and transaction recording. If there are signs that database transactions can no longer guarantee consistency under ACID, or a race condition appears that can charge a user twice or create a phantom balance: Immediately enable Maintenance Mode.
Downtime may cost the business a few hours of revenue, but a database with broken consistency can permanently damage the company’s reputation, introduce legal liability, and lead to a painful amount of manual reconciliation afterward.
From Temporary Mitigation to the Discipline of a Blameless Post-Mortem
A successful mitigation that is not carefully followed up can quickly turn into a dumping ground for technical debt. I’m sure most of us have heard plenty about Technical Debt already.
Setting up a cronjob to automatically restart a service whenever it runs out of RAM can be a smart emergency move by an On-call Engineer during a night shift.
Letting that cronjob quietly keep running for the next several months is irresponsible 😀
For the operational process to actually be good, every emergency intervention should follow a closed loop. I’ll share the process we use as well. Nothing to hide here.
1. The Golden Ticket Rule
Every “hot” intervention in Production, whether that means manually changing environment variables, scaling pods beyond the budget ceiling, disabling a feature flag, or disabling a foreign key, must be accompanied by a highest priority P0/P1 Ticket created immediately after the War Room is closed.
2. Blameless Post-Mortem
Within 24 to 48 hours after the incident, everyone involved should sit down together and perform a detailed incident analysis without criticism or blame:
- Build a detailed minute by minute timeline: When did the incident begin? When did the alert fire? Which mitigation command was triggered, and when?
- Apply the 5 Whys technique to find deeper architectural or testing process causes instead of blaming the individual who typed the deployment command.
3. Properly Closing an Incident
An incident should only be considered fully resolved when all of the following are true:
- The complete fix has been merged, regression tested, and safely deployed to Production.
- All temporary intervention configurations, such as Feature Flags, emergency rate limits, or restart cronjobs, have been cleaned up or removed entirely.
- New alert metrics have been added to the monitoring system so similar symptoms can be detected earlier, before they have a chance to escalate into another Severity 1 incident.
That’s It
In my view, an engineer’s professional maturity is not measured only by the ability to write complex code or optimize an algorithm down to the last microsecond.
It also shows itself very clearly in the war room: knowing when to put professional pride aside, stop inspecting code line by line for a moment, and decisively pull the “emergency switch” to preserve system availability for the users in front of you.
I also highly recommend that anyone working with on-premise infrastructure consider getting CNCF’s CKA certification. It adds a lot of useful knowledge around Kubernetes infrastructure administration. There are already plenty of articles and learning resources shared by other people on the DevOps VietNam website as well.